
Africa: Why the cost of capital remains high
In Francophone Africa, the cost of borrowing is not merely high; it is structurally high, for reasons that extend far beyond interest rates. For the female trader in Dakar, the SME in Douala, or the entrepreneur in Abidjan, the difference between their cost of capital and that borne by comparable borrowers elsewhere is not solely a matter of monetary policy. It stems from an architecture of overlapping institutional deficiencies: incomplete credit information, slow contract enforcement, crowding-out effects due to government financing, and fee structures that disproportionately burden smaller loans. This analysis maps this architecture and explains why it diverges so sharply between the UEMOA and the CEMAC, despite their shared currency.
The starting point
A shopkeeper in Dakar needs two million CFA francs. Her shelves are emptying. Customers keep coming. The demand is there. But to restock, she has to borrow. She goes to her bank. The answer comes back: once the nominal interest rate, processing fees, mandatory insurance, and the cost of guarantees are factored in, the actual cost of financing is significantly higher than the published bank average suggests. This gap between the rate published by the regulator and the rate actually paid by the borrower is not insignificant. It stems from a specific institutional framework that determines access to credit, its pricing, and ultimately, who actually obtains financing.
To understand why credit is so expensive, a key distinction is essential. The average rate of 6,76% published by the BCEAO (Central Bank of West African States) is indeed real, but it is weighted by volume. It reflects the rates obtained by large companies, multinationals, and borrowers linked to the public sector, which account for the bulk of credit distributed. A few billion francs lent to a public treasury or a large regional group is enough to significantly lower the average. Depending on the borrower's profile, the quality of the collateral, and the financing channel, the actual cost of financing for an SME can easily reach double-digit levels, well above the published average. This discrepancy is not an anomaly. It stems from structural conditions that disproportionately penalize smaller and less well-documented borrowers.
To understand the origin of this gap, we need to go back further. A loan doesn't begin when a customer walks through a bank's door. It starts much earlier, with everything the bank must resolve before it can lend: where to find its capital, how to assess the borrower's risk, and what happens if the loan goes wrong. The cost of financing alone, therefore, is not enough to explain the gap. Risk, the ability to measure it correctly, and the capacity to enforce a contract when a borrower defaults are at least as crucial.
The interest rate paid by a borrower is not a single figure. It is the sum of all the problems the bank had to solve before making the loan possible.
In developed banking markets, banks benefit from deep capital markets, but also from widely covered credit bureaus, standardized financial statements, faster courts, and more predictable collateral enforcement procedures. All of these factors reduce uncertainty. In Francophone Africa, capital markets are less deep, and many of these supporting institutions remain underdeveloped. Each deficiency adds a component to the rate.
The four layers that make up the rate
A bank doesn't just lend money. It prices risk. To measure this risk, it needs information: the borrower's income, economic activity, financial history, collateral, and repayment behavior. The more complete the information, the easier it is to measure the risk. The more limited the information, the more uncertainty accumulates. And when a bank faces more uncertainty, it adds a risk premium. The rate increases.
One structural factor deserves particular attention: the sovereign crowding-out effect. In the UEMOA, banks hold approximately 37% of their assets in government bonds, according to the IMF. In the CEMAC, this proportion reached approximately 30% at the end of 2024. Government bonds offer banks an attractive risk-adjusted return with limited capital consumption under current regulatory frameworks. When banks can obtain reasonable returns on sovereign instruments without bearing the burden of individual credit analysis, the incentive to lend to SMEs and households is structurally reduced. And the private credit that is nevertheless granted is priced to compensate for the risks taken by the bank when it chooses this option rather than the sovereign alternative.
Same currency, different financial circuits
Even within the Franc Zone, the results are not identical. The West African Economic and Monetary Union (UEMOA) has gradually built a more integrated financial ecosystem: a regional stock exchange, the BRVM, a regional bond market, and more diversified financing mechanisms. The Central African Economic and Monetary Community (CEMAC) has a different structure: financial activity remains more concentrated around states, large corporations, and the extractive sectors, while banks' sovereign exposure represented approximately 30% of their assets at the end of 2024, according to the IMF. Same currency. Different financial circuits.
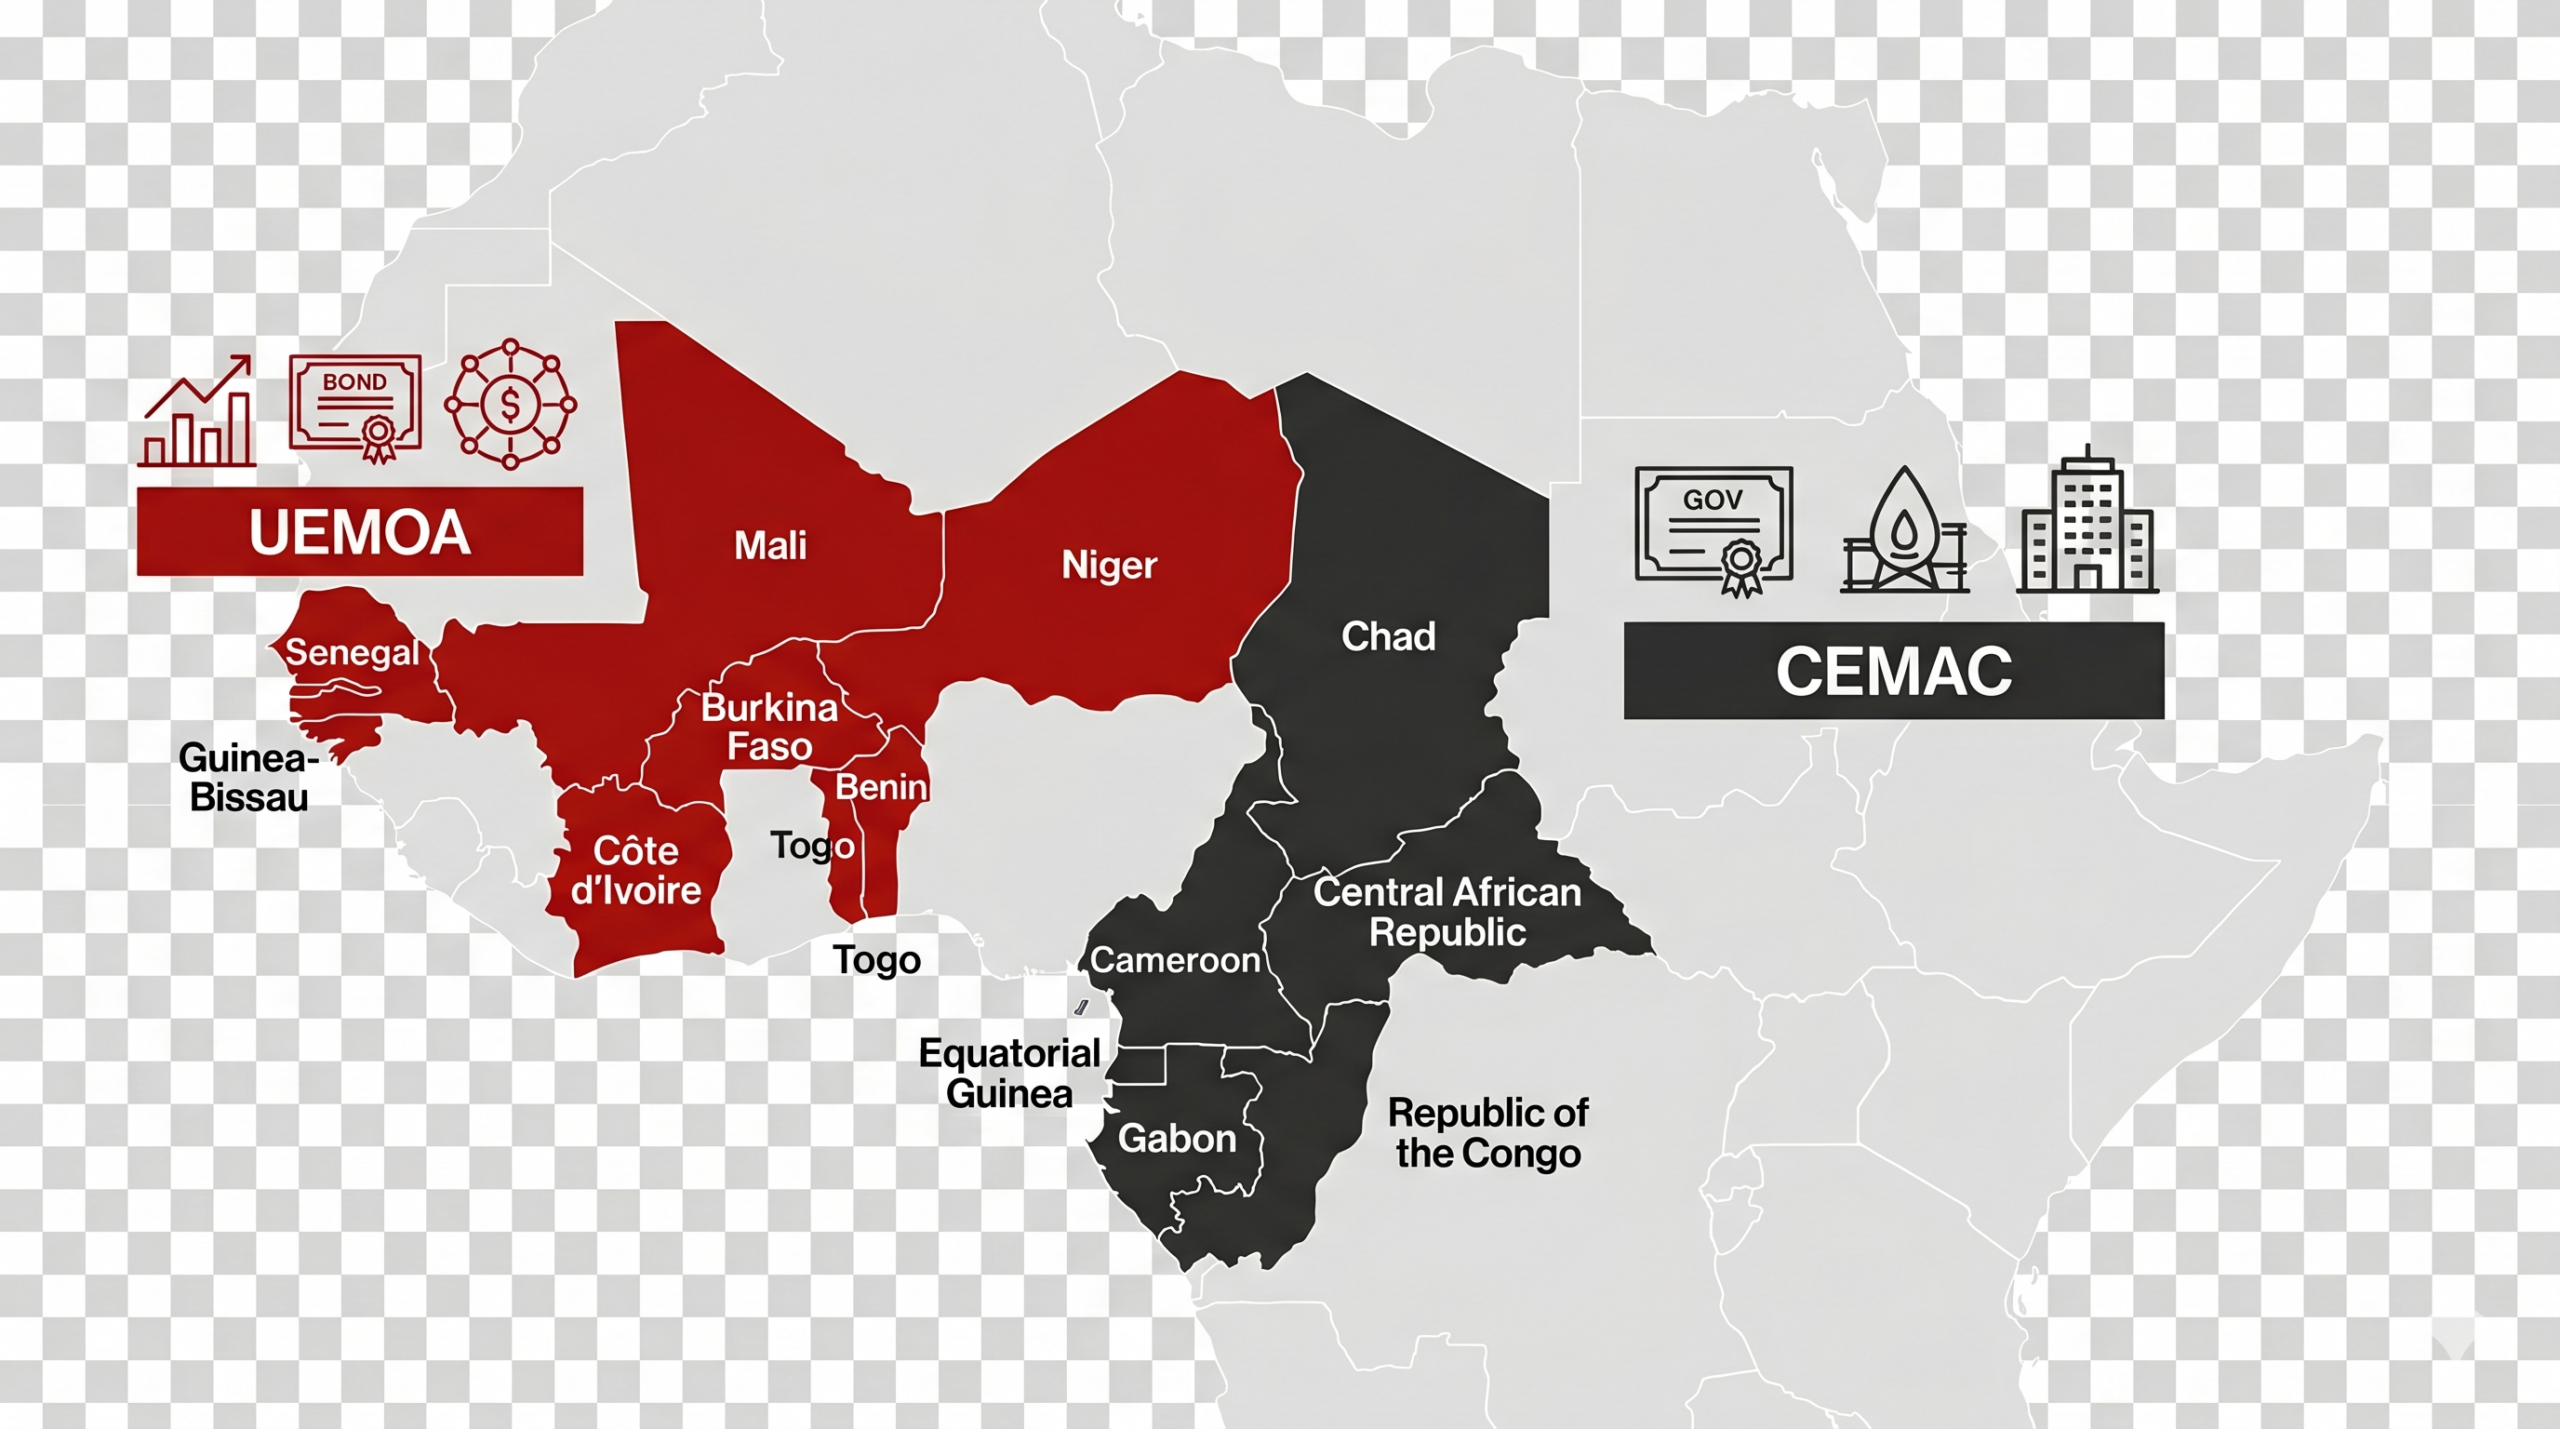
This is not purely a monetary issue. It is also institutional. Higher interest rates and lower credit penetration in the CEMAC region reflect a financial ecosystem that has diversified more slowly beyond revenues linked to commodity cycles and government financing. For private sector borrowers, particularly SMEs, these structural differences directly impact access to credit and its pricing.
What rate does each borrower actually pay?
The regional average masks considerable disparities. Within the same banking system, the rate applied to a government is structurally lower than that applied to a household. And within the corporate segment, a large company obtains credit on terms that a small business cannot match. The BCEAO's 2024 Banking Conditions Report and BEAC data for Q4 2025 allow us to precisely map this hierarchy in both regions.
| Country | Rates | Note | Source |
|---|---|---|---|
| UEMOA · 8 States · Nominal rates | |||
| Senegal | 5,8 % | Lowest rate in the area | BCEAO 2024 |
| Ivory Coast | 6,3 % | 1st UEMOA market by volume | BCEAO 2024 |
| Benin | 7,2 % | BCEAO 2024 | |
| Togo | 7,5 % | BCEAO 2024 | |
| Mali | 7,5 % | BCEAO 2024 | |
| Burkina Faso | 7,8 % | BCEAO 2024 | |
| Niger | 9,8 % | Highest rate in the UEMOA | BCEAO 2024 |
| CEMAC · 6 States · effective rates, fees included | |||
| Chad | 7,22 % | Lowest rate in the CEMAC | BEAC T2 2025 |
| Cameroon | 7,92 % | ~45% of CEMAC bank credit | BEAC T2 2025 |
| RCA | 9,84 % | BEAC T2 2025 | |
| Congo | 11,75 % | BEAC T2 2025 | |
| Equatorial Guinea | 15,59 % | BEAC T2 2025 | |
| Gabon | 22,28 % | Extreme value outside the regional average | BEAC T2 2025 |
The dispersion within each zone is as significant as the gap between the two zones. In the UEMOA, the difference between the rate paid by a state (5,52%) and that paid by a household (8,88%) represents more than three percentage points in nominal terms alone. In the CEMAC, the difference between a large company (10,24%) and an individual (16,71%) exceeds six points. These rates are before fees. The practical gap widens even further when the total cost of financing is calculated.
The disparity between countries is particularly striking in the CEMAC region. Cameroon, which accounts for more than 45% of regional bank credit, has an average effective interest rate of 7,92%, close to the levels observed in the UEMOA. Gabon, at 22,28% in Q2 2025, represents an extreme case where weak competition, high credit risk, and concentration in the extractive sectors have resulted in borrowing costs approaching prohibitive levels. Same currency, same central bank, radically different markets.
The advertised rate is not the rate actually paid
The nominal rate, that is, the figure announced by a bank and cited by the BCEAO or BEAC in its surveys, excludes a range of standard charges in both zones. The APR, or annual percentage rate, the disclosure of which is legally mandatory in UEMOA markets, is supposed to include these additional costs. In practice, the application of the obligation to fully disclose the APR remains inconsistent, and the statistics published by the BCEAO capture the nominal rate, not the APR. For investors and operators who model the true cost of financing, this discrepancy is considerable.
Two features of this cost structure deserve attention. First, fixed charges, such as application fees and collateral registration costs, disproportionately penalize smaller loans. A 2% application fee on a 2 million FCFA loan represents 40,000 FCFA, reducing the actual disbursement, while interest is calculated on the entire principal amount. The smaller the loan, the heavier the burden of fixed costs. This is one reason why microfinance products with seemingly moderate nominal rates can reach effective rates of 24% or more once all charges are factored in.
Secondly, the figures for CEMAC and UEMOA are not directly comparable without adjustment. The BEAC's effective rate already includes fees and commissions in the published average; the BCEAO's figure explicitly excludes them. Comparing 6,76% (nominal UEMOA rate) to 11,5% (effective CEMAC rate) therefore underestimates the real difference. Using comparable methodologies, the effective cost to SMEs in UEMOA is generally around 10–14%, compared to 14–20% in the main CEMAC markets, excluding the extreme case of Gabon.
Key concepts: risk premium, credit bureaus, crowding-out effect
Three structural characteristics determine the architecture of the cost of credit in Francophone Africa. Understanding them is essential for interpreting any claim about financial inclusion or credit reform.
Who has access to credit, and who remains excluded?
Not all borrowers face the same conditions. Large corporations borrow. Multinationals borrow. Governments borrow. Companies with strong collateral borrow. For many SMEs, traders, farmers, and young entrepreneurs, access remains significantly more difficult. According to analyses by the World Bank and the IMF on the UEMOA, the formal banking system remains heavily oriented towards large corporate clients and public financing, while SMEs and households receive a disproportionately small share of total credit relative to their contribution to economic activity.
Credit to the private sector represents approximately 24% of GDP in the UEMOA and around 14% in the CEMAC, compared to significantly higher levels in most advanced European economies. The gap is considerable. But this is not due to a lack of ambition. It is due to a deficit in financial infrastructure: the capacity to identify borrowers, accurately assess risk, and enforce contracts when they are breached.
When credit remains inaccessible or too expensive, the entire economy slows down. Businesses invest less. They hire less. They produce less. They grow less. Every percentage point above a reasonable level acts as a tax on ambition. And this tax falls hardest on those who can least afford it.
- Three numbers, one story. The BCEAO nominal average of 6,76% measures the price of credit for governments, multinationals, and large corporations. An APR of 7–9% captures the formal cost of an SME loan once fees and insurance are added. The full effective cost of financing for an undocumented borrower, once collateral requirements, legal costs, and disbursement delays are factored in, easily rises into double digits. Confusing these three figures systematically leads to a misleading interpretation of African credit markets.
- The sovereign crowding-out effect remains an insufficiently discussed factor. As long as banks in the UEMOA and CEMAC regions can obtain attractive risk-adjusted returns on government bonds without bearing the operational cost of individual credit analysis, the structural incentive to increase private lending remains limited. Reducing this dynamic requires either better SME risk assessment tools or direct regulatory intervention on the concentration of sovereign assets. Neither of these issues is close to being resolved.
- Mobile data is a signal, not yet a solution. Mobile money transaction histories can help create alternative credit profiles for previously underserved borrowers. Adoption remains uneven, interoperability between operators and banks is incomplete, and evidence of a large-scale impact on credit rates remains limited. The direction is right. There is still a long way to go.
- Interest rate cuts are necessary, but insufficient. The BEAC lowered its rate to 4,50% in March 2025, and the BCEAO to 3,25% in mid-2025. The translation of these signals into lower SME lending rates depends on the parallel evolution of structural factors: risk pricing, recovery mechanisms, and sovereign concentration. Historically, these factors have not evolved rapidly solely as a result of monetary easing.
What is changing today
Several developments that occurred in 2024 and 2025 deserve to be followed by players operating or investing in Francophone African markets.
Mobile money as a potential credit signal. The fintech regulatory framework adopted by the BCEAO in 2024 created the first formal regulatory basis enabling fintechs to offer credit products based on alternative data. Transaction histories from mobile money operators could increasingly be used to build credit profiles for borrowers without formal banking relationships. WaveOrange Money and several fintech companies focused on the UEMOA region are reportedly exploring scoring models built from payment data. It remains to be seen whether this will translate into a significant decrease in credit rates on a large scale.
The transition to Basel in the UEMOA. The UEMOA Banking Commission is continuing its transition to frameworks aligned with Basel III standards. An analysis published in 2026 in Financial Afrik notes that, even though the UEMOA banking system boasts a solvency ratio of 14,7%, well above the regulatory standard of 11,5%, the Basel risk-weighting framework creates a structural bias against SME lending: when borrowers have incomplete financial statements and collateral is difficult to obtain, productive lending becomes inherently more capital-intensive. Adapting these frameworks to the profiles of UEMOA borrowers is a prerequisite for the large-scale expansion of SME lending.
The momentum for reform in CEMAC. In December 2024, the heads of state of the CEMAC committed to launching a new series of structural reforms. The IMF noted the slow pace of their implementation. The BEAC's rate cut in March 2025 was the first since 2023. The ability of lower policy rates to translate into lower SME lending rates will depend on the simultaneous progress of banking sector reforms, particularly the resolution of non-performing loans (NPLs) and the reduction of sovereign exposure.
- Will the BCEAO's 2024 fintech regulation enable the creation of a functional infrastructure for alternative credit scoring in the UEMOA, or will the fragmentation of data between mobile money operators and banks prevent it from scaling up?
- Can the BEAC and the CEMAC member states reduce sovereign concentration in bank portfolios without causing a liquidity shock in the public securities market, on which several states are heavily dependent on the appetite of regional banks?
- Will the transition to Basel in the UEMOA be calibrated to the reality of the profiles of SME borrowers in the region, or will risk weighting frameworks designed for developed markets continue to penalize productive private credit?
- Broader coverage of credit bureaus reduces information asymmetry between banks and SME borrowers
- Faster and more predictable contract execution under OHADA, reducing the recovery risk premium embedded in each loan
- Regulatory caps on the concentration of sovereign assets, redirecting banks' incentives towards lending to the private sector
- Deeper regional capital markets, BRVM and UMOA-Titres, reducing the cost of loanable capital for UEMOA banks
- Mobile money transaction data allows for the creation of alternative credit identities for previously unbanked borrowers.
- Basel III weighting frameworks calibrated to the profiles of SMEs in the UEMOA and CEMAC regions rather than imported European standards
- Sovereign crowding-out effect: States absorb 30–37% of banking assets in both areas, thus limiting lending capacity to the private sector
- High NPL ratios, 8,5% in UEMOA and ~14% in CEMAC proxy, along with incomplete provisioning, which shift the risk premiums onto all new borrowers
- Volume weighting effect: the averages published by the BCEAO are skewed by loans to large clients and mask the real cost for SMEs
- Fixed fees, processing fees, insurance, notary fees, VAT, which impose a disproportionate effective interest rate burden on small loan amounts
- Poor enforcement of APR publication requirements: borrowers cannot accurately compare the total cost of financing between lenders.
- Financial fragmentation of the CEMAC: Gabon, with over 22%, and Cameroon, with less than 8%, coexist in the same monetary union
The credit cost gap in Francophone Africa is not a function of greed or incompetence. It results from the arithmetic of environments where information about borrowers is incomplete, contract enforcement is slow, capital is directed toward sovereign instruments rather than private enterprise, and fixed banking transaction costs disproportionately affect smaller borrowers. Each of these conditions constitutes a public policy variable. None is beyond the reach of reform. But none has historically changed rapidly.
The most underestimated structural factor is the sovereign crowding-out effect. The debate on the cost of credit in Africa often focuses on risk premiums and credit bureau coverage, two very real factors. What receives less attention is a simple economic logic: as long as banks in the UEMOA and CEMAC regions can hold 30–37% of their assets in government securities with lower operating costs and regulatory capital consumption than SME lending, the incentive to develop private credit remains structurally limited. No single fintech scoring innovation can, on its own, correct this incentive structure.
The UEMOA has structural advantages over the CEMAC, as evidenced by the data: a regional stock exchange, a regional bond market, lower average interest rates, and stronger credit growth. These are not coincidental. They reflect a more integrated financial architecture, built up over several decades. The higher interest rates and lower credit penetration in the CEMAC are, to a large extent, the market result of a less diversified financial ecosystem, still heavily concentrated on sovereign revenues linked to the oil cycle and credit to large corporations. The structural divergence within the Franc Zone itself is one of the most important elements for understanding the trajectory of African financial development and the conditions necessary for progress.
Primary data, BCEAO: Average UEMOA credit rate of 6,76%; rates by borrower category, public administrations 5,52%, households 8,88%; rates by country; credit volume by borrower type: BCEAO, Report on banking conditions in UEMOA, 2024, published in July 2025. Rates from country surveys, Côte d'Ivoire ~6,3%, Senegal ~5,8%, etc.: BCEAO monthly surveys on banking conditions, 2023–2024.
Primary data, BEAC and CEMAC: CEMAC interest rates by borrower type: large corporations 10,24%, SMEs 13,15%, individuals 16,71%, government 11,24%, and an effective rate of 11,5% in Q4 2025: BEAC, Monetary Policy Report Q4 2025, as reported by Agence Ecofin in April 2026. Rates by country: Cameroon 7,92%, Chad 7,22%, Central African Republic 9,84%, Congo 11,75%, Equatorial Guinea 15,59%, Gabon 22,28%: BEAC, Monetary Policy Report Q2 2025, as reported by Business in Cameroon in October 2025; figures not independently verified against the BEAC primary publication for all countries. BEAC key interest rate cut to 4,50%: BEAC press release of March 24, 2025, confirmed by Agence Ecofin.
Institutional and multilateral sources: Credit to the private sector in UEMOA at 24% of GDP and sovereign exposure at ~37% of banking assets: IMF, UEMOA Article IV Consultation, 2025. CEMAC sovereign exposure at ~30% of banking assets at the end of 2024: IMF, CEMAC Regional Economic Outlook, Country Report No. 25/171, 2025. UEMOA gross NPL ratio of 8,5% and solvency ratio of 14,7%: 2024 Annual Report of the UEMOA Banking Commission, cited by Financial Afrik in February 2026. Cameroon's NPL ratio of 14,3%: African Development Bank, cited by Business in Cameroon in July 2024. Average UEMOA NPL provisioning of 61,8%: Ecofin Agency, citing BCEAO data, September 2025. CEMAC credit/GDP ~14%: World Bank directional estimate. 2024; no official consolidated CEMAC figures are publicly available. Reduction of the BCEAO main refinancing rate to 3,25%, marginal lending facility to 5,25%: BCEAO Monetary Policy Committee, mid-2025.
Secondary analyses: Basel II/III transition in the UEMOA: Thierno Seydou Nourou SY, Financial Afrik, February 2026. VAT rates: Ivory Coast and Senegal, normal rate of 18%; Cameroon, VAT 19,25%, confirmed by national tax codes.
Editorial Note: The figures in this article are directionally accurate, with some illustrative estimates and some data requiring verification of the primary source before citation. The rate breakdown is illustrative: the component sizes correspond to directional estimates and not audited breakdowns of individual banks. The BCEAO average of 6,76% is volume-weighted, dominated by loans to large clients, and is not representative of SME borrowing conditions. The effective cost of SME financing range is an analytical estimate ofAfrica SignalThis is not a published statistic. The CEMAC credit/GDP and CEMAC effective interest rate figures should be considered directional. The effective interest rate of 24,81% in Gabon, BEAC 2025, represents an extreme value within CEMAC and is not included in any of the regional averages cited here. All analytical conclusions are the sole responsibility of the editorial judgment of [author's name].Africa Signal.